Accepted to ICML 2026

Temporal Difference Calibration in Sequential Tasks:
Application to Vision-Language-Action Models

Shelly Francis-Meretzki*  Mirco Mutti  Yaniv Romano  Aviv Tamar

Technion — Israel Institute of Technology

Abstract

Sequential Calibration for Robot Manipulation

Recent advances in vision-language-action (VLA) models for robotics have highlighted the importance of reliable uncertainty quantification in sequential tasks. However, assessing and improving calibration in such settings remains mostly unexplored, especially when only partial trajectories are observed. In this work, we formulate sequential calibration for episodic tasks, where task-success confidence is produced along an episode, while success is determined at the end of it. We introduce a sequential extension of the Brier score and show that, for binary outcomes, its risk minimizer coincides with the VLA policy's value function. This connection bridges uncertainty calibration and reinforcement learning, enabling the use of temporal-difference (TD) value estimation as a principled calibration mechanism over time. We empirically show that TD calibration improves performance relative to the state-of-the-art on simulated and real-robot data. Interestingly, we show that when calibrated using TD, the VLA's single-step action probabilities can yield competitive uncertainty estimates, in contrast to recent findings that employed different calibration techniques.

Unified Brier validation unseen split (with π₀-FAST)
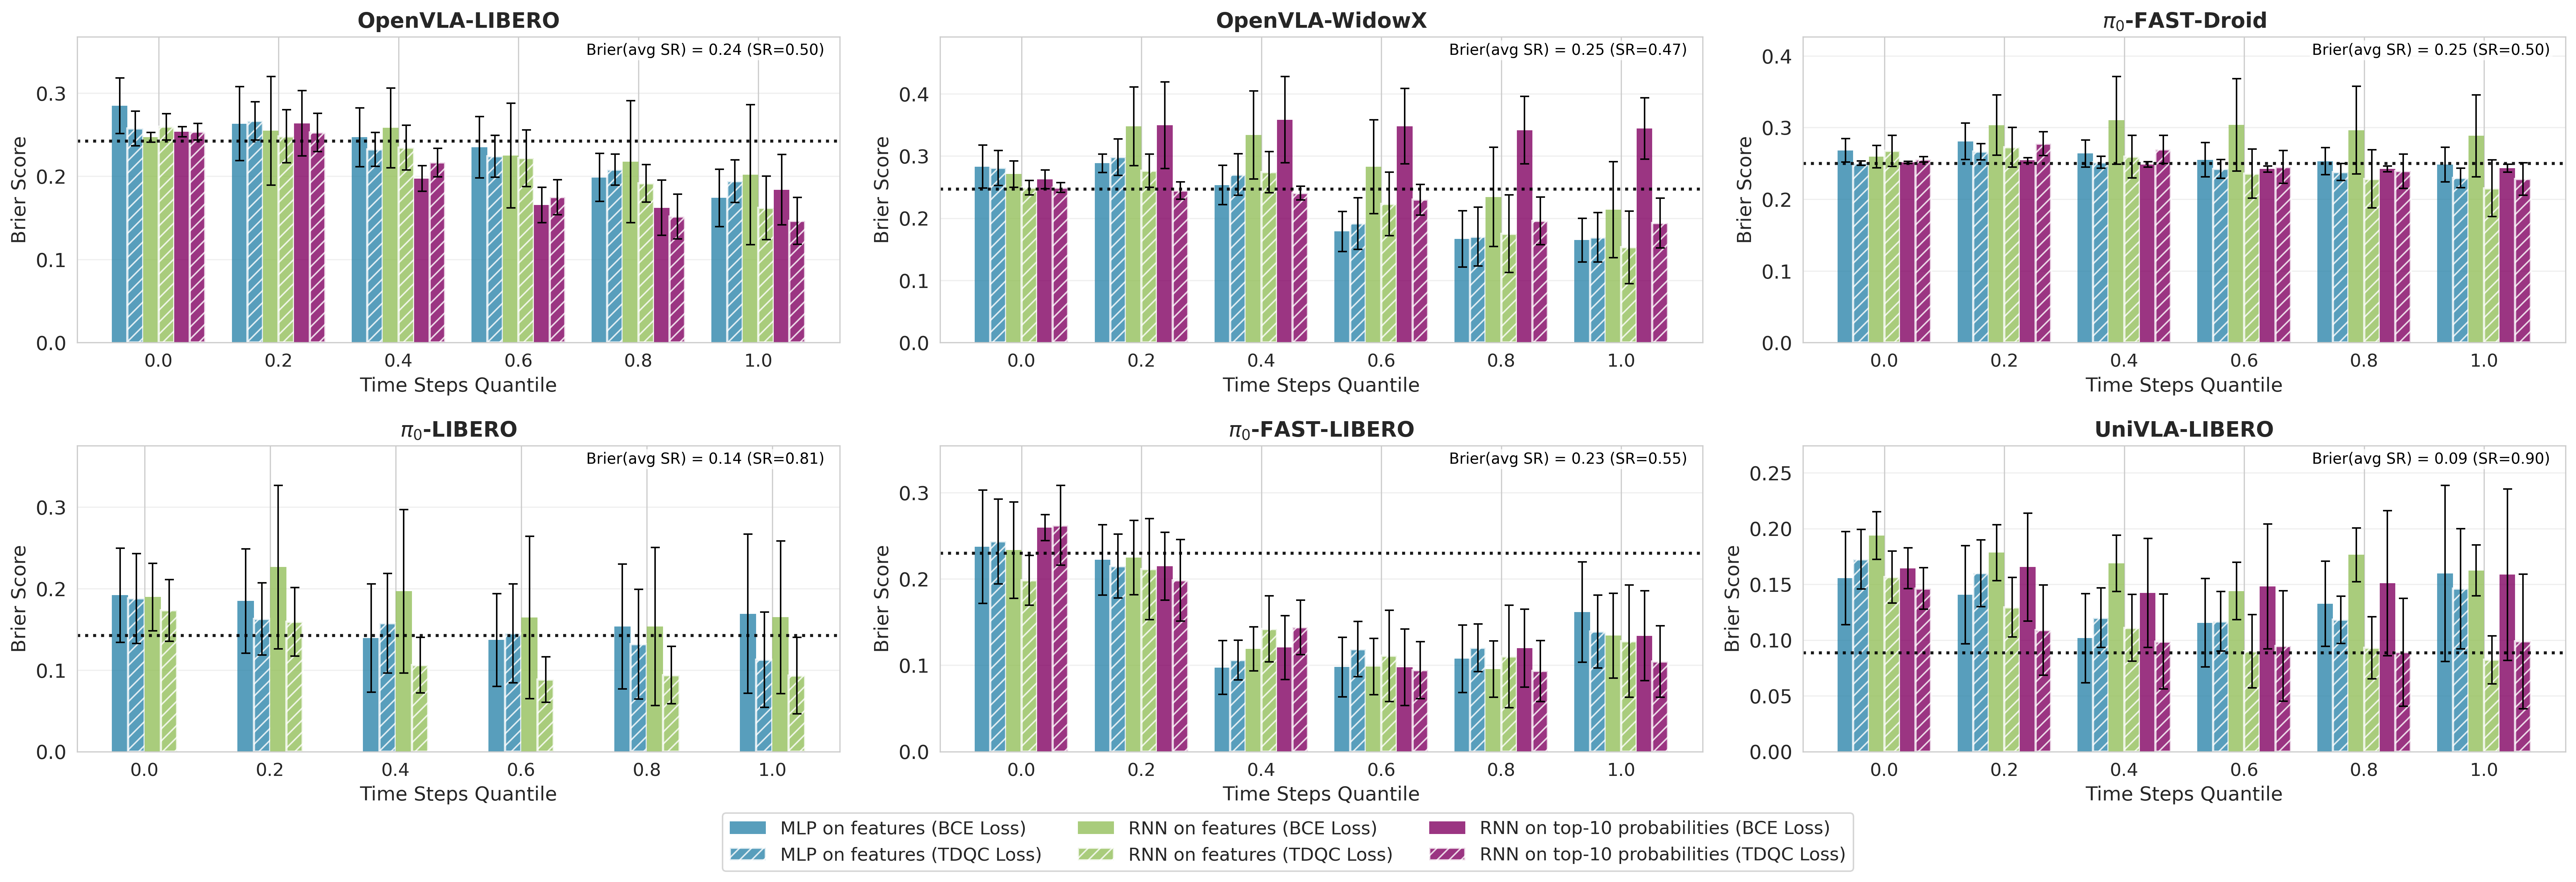
Figure 1 — Brier Score · Validation (Unseen Split)
Sequential Brier score (lower is better) on an unseen validation set averaged over 21 random seeds (train/validation task splits). To compare calibration across rollouts with different lengths, we report Brier score over time quantiles. Each subplot corresponds to a (VLA model, benchmark) pair. Success prediction methods are based on sequences of features or action probabilities. Across all settings, our TD-based methods consistently outperform conventional predictors trained with binary cross entropy (BCE). For \(\pi_0\) action probabilities are not directly interpretable, hence probability-based TDQC variants are not reported. The dotted horizontal line represents the Brier score of a constant predictor that consistently outputs the empirical mean success rate computed over the seen tasks (see Remark 4.2).
Contributions

What TDQC Brings

Sequential Calibration Framework

A coherent formulation for calibration in sequential tasks, unifying recent VLA failure-detection work with the broader calibration literature.

RL Connection

Sequential calibration is linked to value prediction in reinforcement learning, deriving a novel TD-based calibration method - TDQC.

Black-Box Practicality

Using only action probabilities, TDQC matches or improves SAFE variants that require hidden-state access - often unavailable through APIs.

Empirical Strength

TD-based losses achieve state-of-the-art early detection on LIBERO with OpenVLA, π₀, and π₀-FAST, and on a Franka real-robot dataset.

Policy Improvement as a By-Product

The TDQC value predictor guides action selection within policy-sampled actions, yielding a 13% increase in success rate of OpenVLA on LIBERO.

Experiments

Results

Evaluated on three robot manipulation benchmarks — LIBERO-10 (simulation), WidowX (real robot), and Franka (real robot) — across four frozen VLA backbones: OpenVLA, UniVLA, \(\pi_0\), and \(\pi_0\)-FAST. Models are trained on the seen task split and evaluated on the held-out unseen split to test out-of-distribution generalization.

Brier Score

↓ Lower is better
VLA Model OpenVLA OpenVLA UniVLA \(\pi_0\)-FAST \(\pi_0\)-FAST \(\pi_0\)
Benchmark LIBERO WidowX LIBERO LIBERO Franka LIBERO
Eval Split SeenUnseen SeenUnseen SeenUnseen SeenUnseen SeenUnseen SeenUnseen
Static Baselines Max prob. 0.3950.390 0.5720.579 0.9090.899 0.3200.318 0.3310.323
Avg prob. 0.3480.364 0.2750.282 0.5290.532 0.2120.218 0.2900.294
Running Avg prob. 0.3380.356 0.2550.257 0.5430.544 0.2440.238 0.3590.361
Avg entropy 0.3060.313 0.4140.426 0.4060.391 0.2090.222 0.2810.281
Running Avg entropy 0.2650.273 0.4350.432 0.3430.330 0.2790.264 0.3410.339
Learned Baselines
(white-box)
SAFE-RNN 0.2040.255 0.1690.213 0.1240.162 0.1060.148 0.2200.288 0.1230.172
SAFE-RNN-TDQC Ours 0.1970.218 0.0960.153 0.0640.100 0.1030.163 0.1500.215 0.0610.097
SAFE-MLP BCE 0.1920.231 0.1270.164 0.0910.158 0.1030.162 0.2060.248 0.0750.137
SAFE-MLP-TDQC Ours 0.1950.229 0.1300.169 0.0660.131 0.1090.150 0.2100.229 0.0680.128
Learned Baselines
(black-box)
RNN-BCE 0.1990.206 0.3010.344 0.1380.152 0.1220.158 0.2370.243
RNN-TDQC Ours 0.1910.197 0.1560.192 0.1000.107 0.1050.141 0.2040.228

Table 1 — Brier Score ↓. Results averaged over 21 seeds. "—" = metric not computable for this method. Red bold = best per column. TDQC achieves the lowest sequential Brier scores on all benchmarks.

Application 1

Early Stopping With Conformal Prediction

TDQC's calibrated success probabilities are thresholded via conformal prediction to trigger safe trajectory termination before task failure.

Early Stopping with Conformal Prediction diagram

ROC-AUC

↑ Higher is better
VLA Model OpenVLA OpenVLA UniVLA \(\pi_0\)-FAST \(\pi_0\)-FAST \(\pi_0\)
Benchmark LIBERO WidowX LIBERO LIBERO Franka LIBERO
Eval Split SeenUnseen SeenUnseen SeenUnseen SeenUnseen SeenUnseen SeenUnseen
Static Baselines Max prob. 54.6455.78 53.2553.20 50.0050.00 61.7563.49 48.6146.64
Avg prob. 47.0848.09 47.4748.30 42.9640.25 47.3648.09 49.4548.03
Running Avg prob. 49.1947.72 49.2046.37 43.0540.29 53.9555.68 52.9549.98
Avg entropy 46.8146.75 50.1949.36 41.3447.36 45.4246.30 49.2849.07
Running Avg entropy 50.4848.09 46.1643.99 51.6356.71 53.7855.44 51.1248.78
Learned Baselines
(white-box)
SAFE-RNN 72.3069.04 75.9570.00 74.4868.13 91.2685.88 70.8556.69 79.9665.03
SAFE-RNN-TDQC Ours 71.6765.12 84.0170.76 73.8364.25 92.0385.49 79.8968.43 88.6682.94
SAFE-MLP 73.5669.53 88.2383.18 74.3963.80 79.0068.36 79.1563.94 86.3379.75
SAFE-MLP-BCE 72.6664.99 85.3871.43 78.8369.74 91.8285.50 73.8258.83 89.7180.53
SAFE-MLP-TDQC Ours 71.2260.09 82.3370.64 76.5566.71 90.2584.44 61.9551.22 86.5772.07
Learned Baselines
(black-box)
RNN-BCE 72.7072.28 69.6967.09 63.4454.37 87.6782.53 59.3253.26
RNN-TDQC Ours 74.2072.72 78.9072.97 72.3070.17 87.5183.39 64.1957.37

Table 2 — ROC-AUC ↑. Results averaged over 21 seeds. "—" = metric not computable. Red bold = best per column. TDQC achieves SOTA results on all benchmarks except WidowX and \(\pi_0\)-FAST.

Brier vs ROC per benchmark animated
Figure 2 —ROC-AUC vs Brier score
ROC-AUC vs Brier score over all learned baselines in all benchmarks at the minimum rollout length. Points are grouped by method and split, with a dashed linear fit; the Spearman correlation is \(\rho = -0.686\) which indicates high negative correlation.
LIBERO-10 (Simulation) — OpenVLA

These LIBERO rollouts compare TDQC (SAFE-RNN-TD0) against the SAFE-RNN-TDQC cross-entropy baseline on identical trajectories.

Task 3 — Put the black bowl in the bottom drawer of the cabinet and close it
RNN-TDQC (Top-10): Actual ✅ → Predicted ✅
TDQC correctly predicts a successful outcome on Task 3. The probe's \(f_\theta(h_t)\) shows spikes in the curve on 'uncertain' parts: when the robot grasps the bowl and when it drops it.
SAFE-RNN-TDQC (Features): Actual ✅ → Predicted ❌
The SAFE-RNN-TDQC fails on the same episode in Task 3: it predicts failure in the middle of a successful trajectory — a false negative TDQC avoids. The conformal prediction band is wider, indicating more uncertainty in \(f_\theta(h_t)\).
SAFE-MLP (Cumsum Loss): Actual ✅ → Predicted ❌
The SAFE-MLP also fails the same episode in Task 3: the failure score rises steadily over the trajectory and rises above the threshold in an unexplained manner.
Task 5 — Pick up the book and place it in the back compartment of the caddy
RNN-TDQC (Top-10): Actual ❌ → Predicted ❌
TDQC correctly identifies a failed trajectory on Task 5. \(f_\theta(h_t)\) declines only when the robot is stuck, enabling timely intervention.
SAFE-RNN-TDQC (Features): Actual ❌ → Predicted ❌
The SAFE-RNN-TDQC baseline also predicts failure on Task 5, but with temporally noisy estimates. Compared to RNN-TDQC (Top-10) that produces smoother failure predictions.
SAFE-MLP (Cumsum Loss): Actual ❌ → Predicted ❌
The SAFE-MLP also predicts failure, from frame 3, early in the trajectory.
WidowX Real-Robot — OpenVLA

Six real-robot clips comparing TDQC, SAFE-RNN-TDQC, and SAFE-MLP on two tasks. On Task 4 only TDQC correctly predicts success; on Task 5 the SAFE-MLP produces a dangerous false positive.

Task 4 — Put blue cup on plate
RNN-TDQC (Top-10): Actual ✅ → Predicted ✅
TDQC correctly predicts success. The failure score decreases monotonically as the rollout progresses, reflecting the accumulation of trajectory information over time.
SAFE-RNN-TDQC (Features): Actual ✅ → Predicted ❌
SAFE-RNN-TDQC incorrectly predicts failure on the same successful rollout (false negative). The failure score rises above the threshold from the first frame
SAFE-MLP (Cumsum Loss): Actual ✅ → Predicted ❌
The SAFE-MLP also fails (false negative), predicting failure in the second frame, while no failure indication is present.
Task 5 — Put the red bottle into pot
RNN-TDQC (Top-10): Actual ❌ → Predicted ❌
TDQC correctly predicts failure, but \(f_\theta(h_t)\) rises above the threshold from the second frame.
SAFE-RNN-TDQC (Features): Actual ❌ → Predicted ❌
SAFE-RNN-TDQC also predicts failure. When the failure score rises above the threshold - the robot was uable to grasp the red bottle.
SAFE-MLP (Cumsum Loss): Actual ❌ → Predicted ✅
The SAFE-MLP produces a false positive: it predicts success throughout a failing trajectory.
Method

How TDQC Works

Problem Setting

Let \(h_t\) denote the history of observations and actions up to time \(t\) in a trajectory of length \(T\), and let \(y \in \{0,1\}\) denote final task success. We wish to learn a function \(f_\theta : \mathcal{H} \to [0,1]\) such that \(f_\theta(h_t)\) is a calibrated estimate of \(\Pr[\text{success} \mid h_t]\) at every step.

Standard post-hoc calibration (e.g., Platt scaling, temperature scaling) was designed for i.i.d. classification. In robotics, observations arrive as a temporally correlated sequence and the outcome label - binary task success - is revealed only at the end. This raises two core challenges:

Temporal inconsistency: the confidence in the current decision may depend on the confidence of future decisions.
Label scarcity: the ground-truth label is typically delayed until episode completion.

Sequential Brier Score & the Value-Function Connection

The standard per-step Brier score \(\mathbb{E}[(f_\theta(x) - y)^2]\) ignores temporal structure. We instead minimize the sequential Brier score - the sum of squared prediction errors across all time-steps:

$$\mathcal{L}_{\text{seq}}(\theta) = \mathbb{E}\!\left[\sum_{t=1}^{T}(f_\theta(h_t) - y)^2 \big| h_t\right]$$

The unique minimizer satisfies \(f_\theta(h_t) = \mathbb{E}[y \mid h_t]\), i.e., the policy's value function \(V^\pi(h_t)\). This motivates the TDQC training objective, which telescopes the loss into:

$$G(\theta) = \sum_{t=1}^{T-1}\!\bigl(f_\theta(h_t) - f_\theta(h_{t+1})\bigr)^2 \;+\; \bigl(f_\theta(h_T) - y\bigr)^2$$

TD-0 Loss in sequential settings - TD consistency terms (left) enforce temporal coherence; the terminal term (right) anchors the final prediction to the ground-truth label.

TDQC Architecture

We parameterize \(f_\theta\) as in the SAFE paper - a model that consumes the hidden states (or action probabilities) of the frozen VLA backbone at each step and outputs a success probability. We evaluate the following variants:

  • SAFE-MLP (white-box): A shallow MLP applied independently at each step, with cumulative losses.
  • SAFE-MLP-BCE (white-box): A shallow MLP trained with binary cross-entropy loss.
  • SAFE-MLP-TDQC (white-box): A shallow MLP trained with the TD-0 loss \(G(\theta)\).
  • SAFE-RNN (white-box): An RNN that processes the full history \(h_t\), enabling temporally coherent predictions.
  • SAFE-RNN-TDQC (white-box): The same RNN trained with the full TDQC loss - our best-performing white-box variant.
  • RNN-BCE (black-box): A sequential model on action probabilities trained with binary cross-entropy.
  • RNN-TDQC (black-box): A sequential model on action probabilities trained with the TD-0 loss \(G(\theta)\).

Training Procedure

Algorithm 1 — TDQC Training
Input: policy \(\pi\), calibration dataset \(\mathcal{D}_{\text{cal}} = \{(h_T^i, y^i)\}_{i=1}^N\)

1 Initialize network weights \(f_\theta,\, f_{\theta^-}\)
2 for until convergence do
3 Sample \(h_T^i\) uniformly from \(\mathcal{D}_{\text{cal}}\)
4 Compute the TDQC loss using a target network:
\(G(\theta) = \sum\limits_{t=1}^{T-1}(f_\theta(h_t^i) - f_{\theta^-}(h_{t+1}^i))^2 + (f_\theta(h_T^i) - y^i)^2\)
5 Update \(\theta \leftarrow \theta - \alpha\,\nabla G(\theta)\)
6 Periodically update target network \(\theta^- \leftarrow \theta\)
7 end for

Citation

Cite this Work

@misc{francismeretzki2026temporaldifferencecalibrationsequential,
      title={Temporal Difference Calibration in Sequential Tasks: Application to Vision-Language-Action Models},
      author={Shelly Francis-Meretzki and Mirco Mutti and Yaniv Romano and Aviv Tamar},
      year={2026},
      eprint={2604.20472},
      archivePrefix={arXiv},
      primaryClass={cs.RO},
      url={https://arxiv.org/abs/2604.20472},
}